The window sticker is one of the few genuinely useful consumer documents in the car business, and it is required by an act of Congress passed in 1958 to stop dealers from hiding markups. Nearly seventy years later it is still the best single page of information about a vehicle — provided you know which numbers are measurements and which are conventions.
Electric vehicles make that distinction harder, because three of the headline figures — range, MPGe, and charge time — are all conditional in ways the sticker cannot fully explain.
Where the range number comes from
The EPA does not test every car itself. Manufacturers run the tests on a dynamometer to a prescribed procedure and submit the results, and the EPA audits a sample. The label range is the result of a five-cycle test regime that includes city and highway cycles, a high-speed aggressive cycle, an air-conditioning cycle, and a cold-temperature cycle.
The five cycles are combined into a single label value with a weighting that leans slightly toward city driving — roughly 55 percent city, 45 percent highway. That weighting is a policy choice about how people drive, and it is why the label number tends to sit above what a highway-heavy driver sees.
Two things follow. First, the number is not inflated in the way urban legend suggests; the procedure is deliberately harsher than the old two-cycle test, which is why label ranges dropped across the industry when it was introduced. Second, it is an average over a mixed drive cycle at moderate ambient temperatures. Your commute is not a mixed drive cycle.
What actually moves your range
Range varies with the physics of moving a mass through air, plus the energy cost of keeping humans comfortable.
Speed. Aerodynamic drag rises with the square of velocity, so a car that returns its label range at 70 km/h will not return it at 130 km/h. Highway range loss is not a defect; it is the shape of the curve.
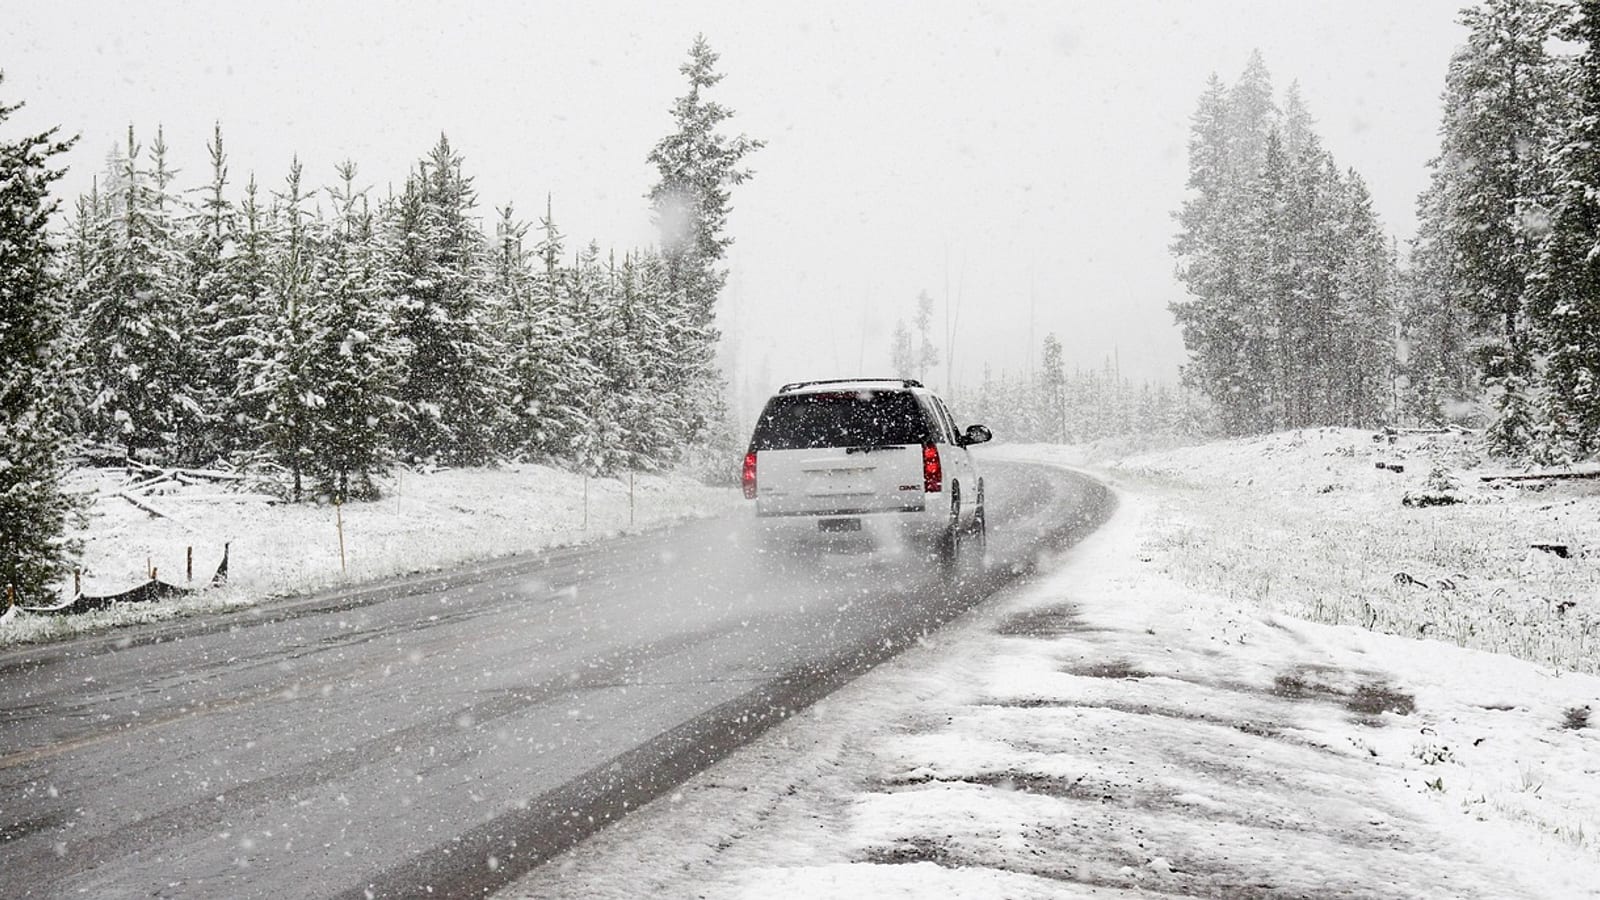
Temperature. Cold reduces usable battery capacity and increases internal resistance, and it forces energy into cabin heating. A heat pump reduces the penalty substantially compared with resistive heating, which is why it appears on so many option lists.
HVAC and preconditioning. Cabin climate control is the largest auxiliary load. Preconditioning while plugged in moves that cost off the battery, which is why the feature exists.
Wheels and tyres. Larger wheels with wider, lower-profile tyres increase rolling resistance and drag. The range difference between wheel options on the same car is often larger than the difference between adjacent trim levels.
The label range is a comparison tool. Treat it as a ranking of efficiency between cars, not as a prediction of your Tuesday.
Advertisement
MPGe, and what it is actually comparing
MPGe exists so that electric cars can be compared with combustion cars on a single scale. The conversion is fixed: one gallon of gasoline is treated as containing 33.7 kilowatt-hours of energy. A car that travels 100 miles on 33.7 kWh is rated at 100 MPGe.
This is a unit conversion, not an efficiency claim about the grid or the refinery. It says nothing about how the electricity was generated, and it does not account for charging losses, which are real and typically a few percent.
The more useful number on the same label is kWh per 100 miles. Multiply it by your electricity price and you have a cost per mile that you can actually check against your bill. That figure is also the one that responds to your driving, because it is a rate rather than a range.
Charge time is the most conditional number on the page
The sticker’s charge time assumes a specific charger type and a specific starting state, and it is usually describing the 240-volt AC case rather than DC fast charging.
For DC fast charging, the peak kilowatt figure in a press release is close to meaningless on its own. What matters is the charging curve: how much power the car accepts as state of charge rises, and how quickly it tapers.
A car with a modest peak that holds power to 70 percent can beat a car with a huge peak that collapses at 40 percent on the same road trip. Since almost all public fast charging happens between roughly 10 and 80 percent, the average power in that window is the number to compare.
Battery chemistry shapes the curve as well. Lithium iron phosphate packs tend to accept charge more conservatively at low states of charge and are happiest being charged to full, while nickel-rich chemistries charge faster in the middle of the range but prefer to live below full for daily use. That difference changes how much of the label range you will actually use day to day.
Advertisement
The numbers that are not on the sticker
Four things worth asking about, none of which the label covers:
Usable versus total capacity. Manufacturers quote gross and net pack capacity, and the gap is the buffer reserved for longevity and peak power. The net figure is the one that determines range.
Degradation warranty. Most packs are warranted for eight years or 100,000 miles with a capacity floor around 70 percent. Read the floor and the terms, because “warranted” means the pack is replaced only if it drops below the floor.
Peak DC power and its window. Ask for the charging curve, or find an independent test. This is the single most useful number for anyone who routinely drives long distances.
Consumption at a steady speed. Independent steady-state tests at 70 and 120 km/h tell you more about road-trip range than any cycle-based figure.
How to use the sticker well
Read it as three separate instruments. Range is a comparative ranking of how far the car goes on a standardised cycle. kWh per 100 miles is a rate you can convert into money. Charge time is a conditional figure that tells you what the car can accept, not what the charger will give it.
None of them will tell you whether the car suits your week. That requires knowing your commute distance, whether you can charge at home, and how often you drive further than 300 kilometres in a day. The sticker is a good instrument. It is not a substitute for the question.